
CONTEXT
The decision-making process in the policy making should rely on data driven evidence, in most of the cases, the raw data needs to be processed to transform it into actionable information. For this purpose, several tools have been developed within the URBANITE project to transform urban mobility data into usable information. Tools are classified into data analysis, simulation and recommendation support.
DATA ANALYSIS
- Amsterdam: https://www.youtube.com/watch?v=dPCjgspd8Hs&t=9s
- Messina: https://www.youtube.com/watch?v=1H5EQ3exyq8&t=24s
- Helsinki: https://www.youtube.com/watch?v=VuQjJnr5W24
- Bilbao: https://www.youtube.com/watch?v=VuQjJnr5W24
Traffic analysis
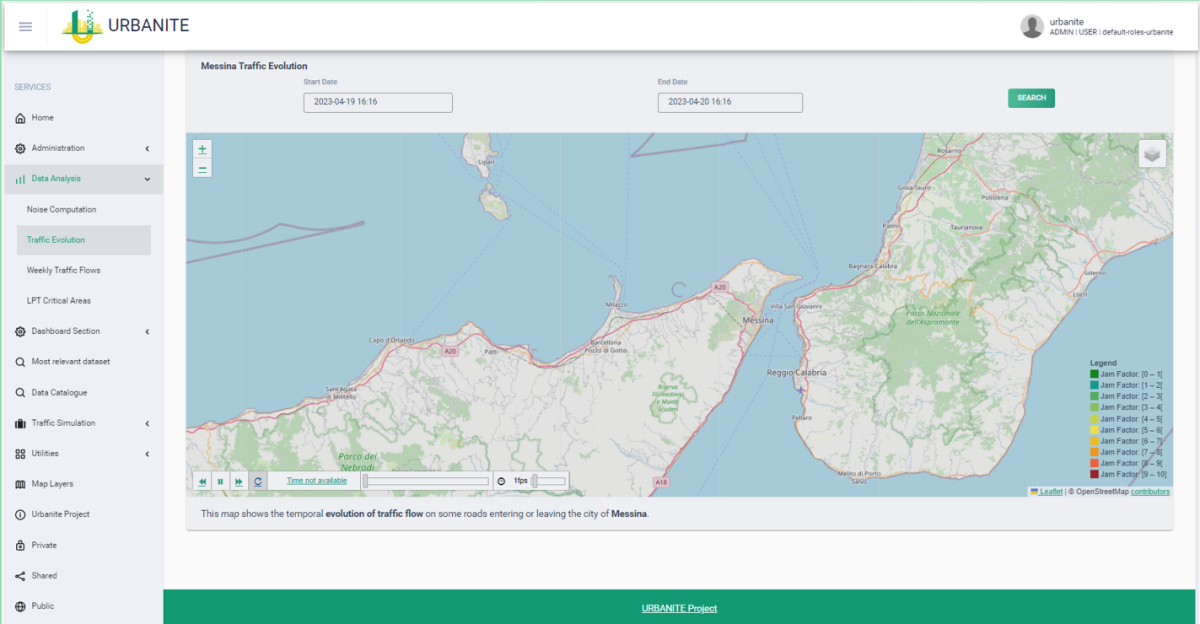
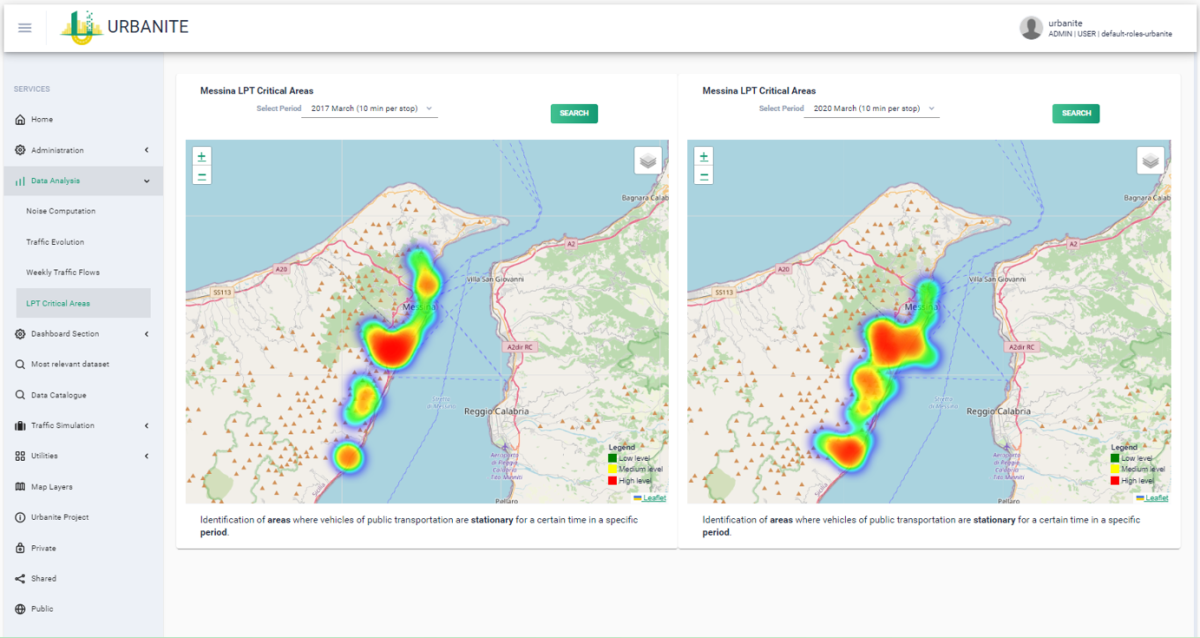
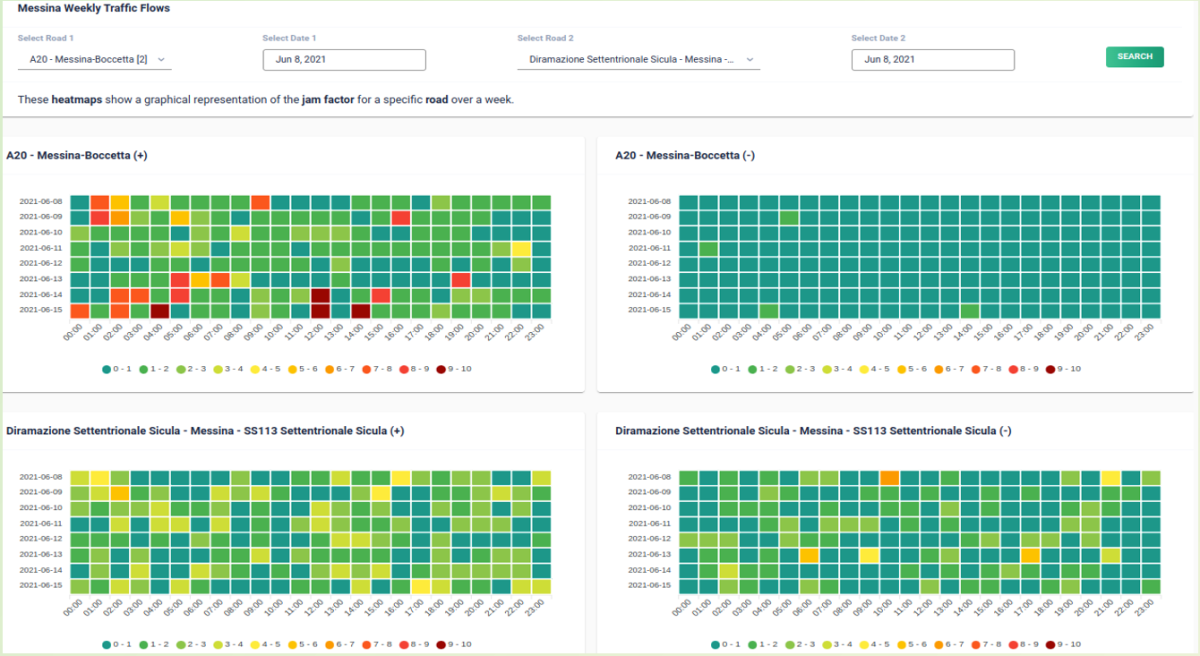
- Weekly Traffic Flows and LPT Critical areas. Analysis of the suburban roads with the surrounding towns, between dates, showing the congestion level by means of an animation by different colours.
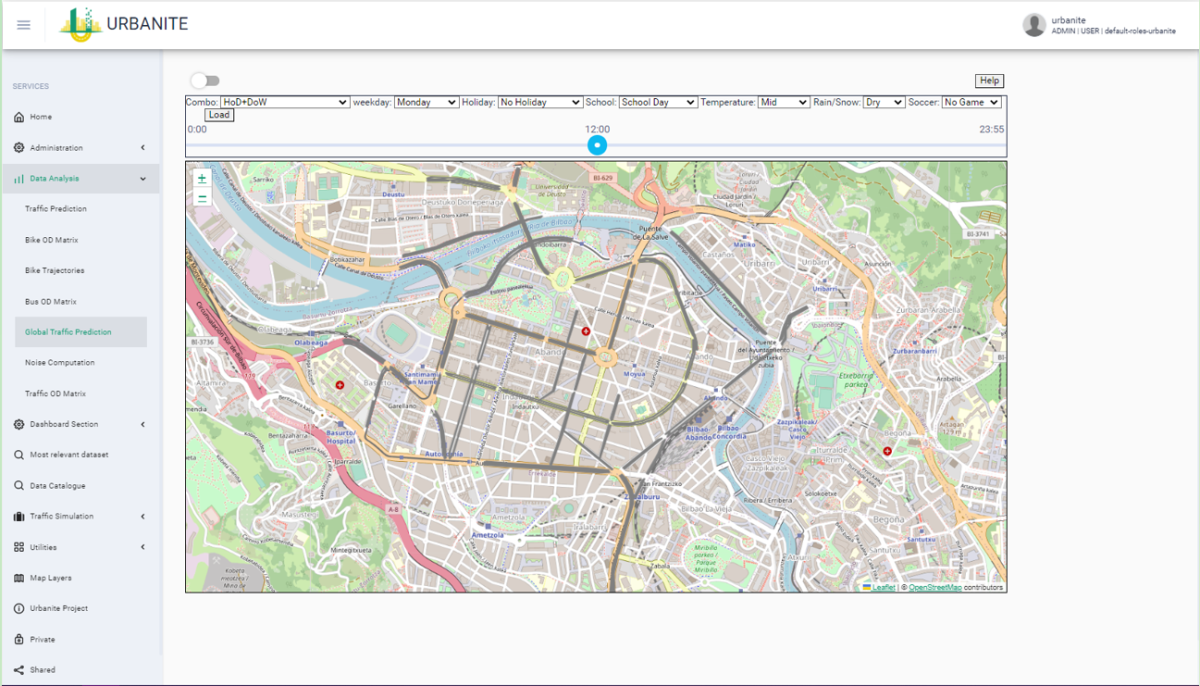
- Traffic prediction and estimation. The set of features include day of the week and time, calendar, weather features (rain/temperature), arrival of ferries to ports or sport events.
- Noise estimation.Noise produced by the cars in a given área based on two different modes of operation: on the navigational map considering only static characteristics of the road, i.e. the number of lanes, size, type of the road, etc. or traffic simulation outputs.
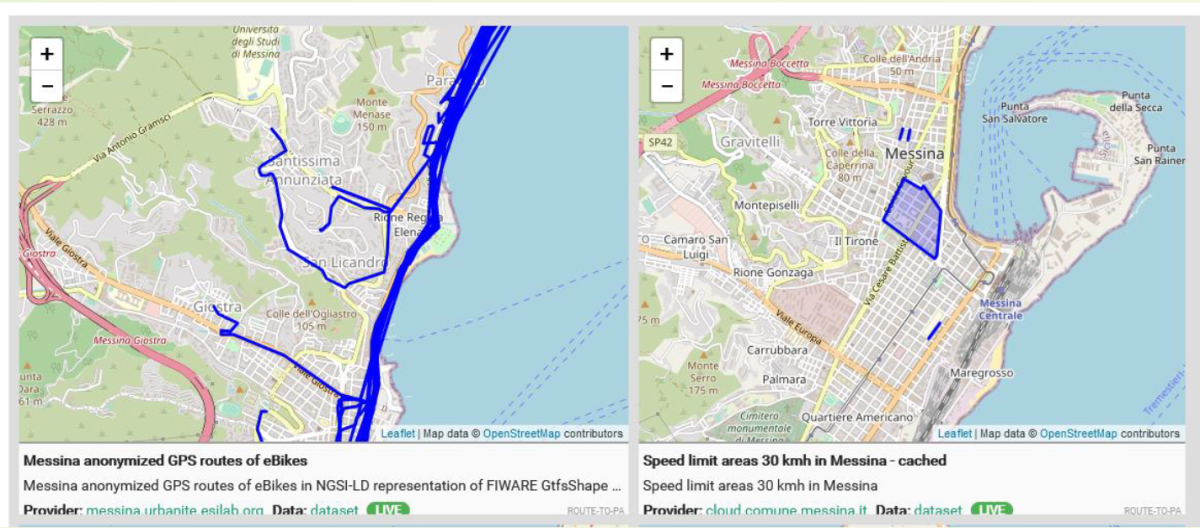
Biking analysis
- Bike OD Matrix Prediction. Analysis of bike rental city service, aggregated both temporally, in hour periods, and spatially, in given districts or regions.
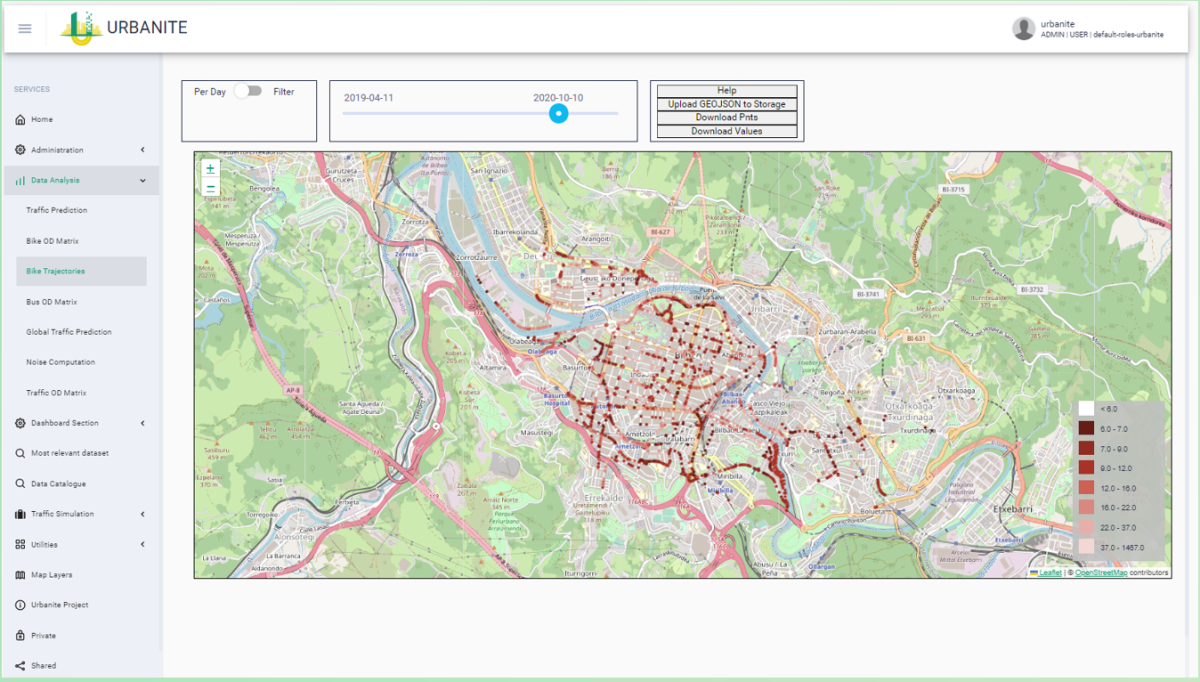
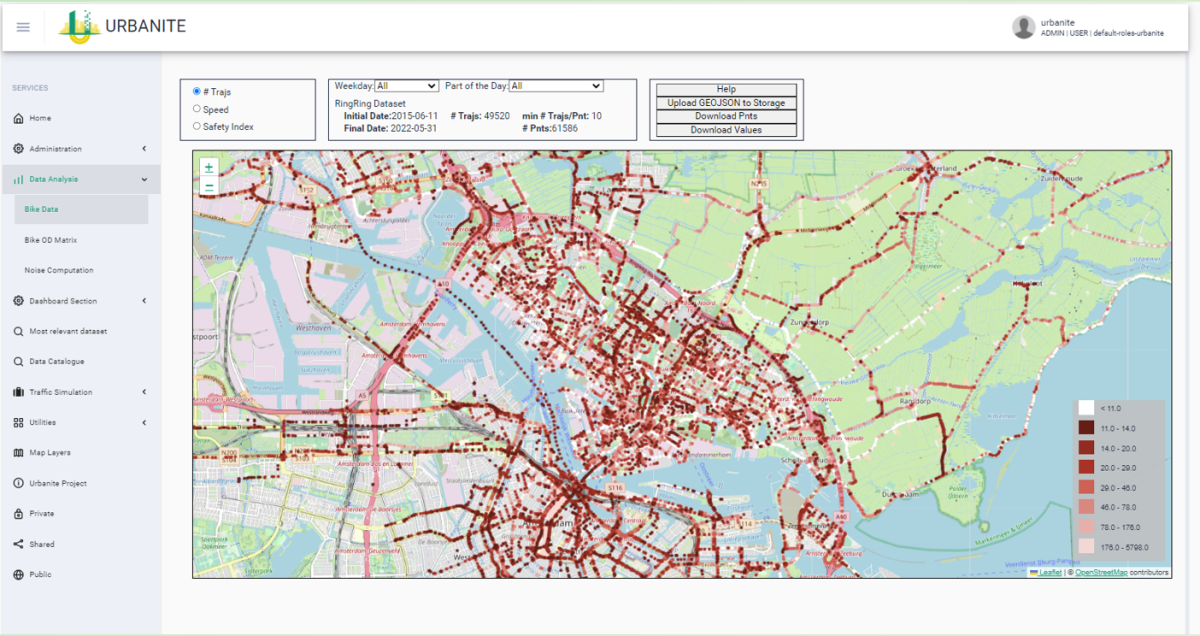
- Bike Trajectories analysis based on continuous positions, where different analyses can also be performed: most likely points to be visited depending on the day and the time, the most popular chain of consecutive points visited, the longest route accomplished, etc.…
- Safety Index. Characterization of network segments based on intrinsic risk for bikers.
Public Transport Analysis
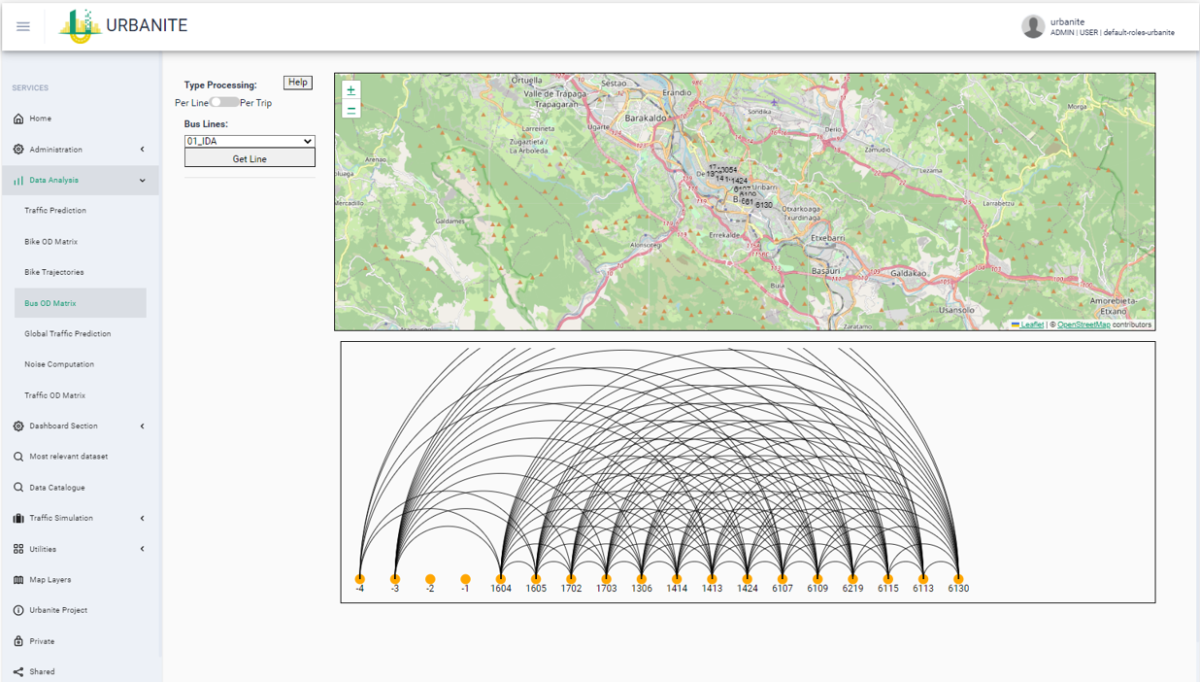
- Bus travel time. Identification of areas where the vehicles are stationary for a certain time in a specific period.
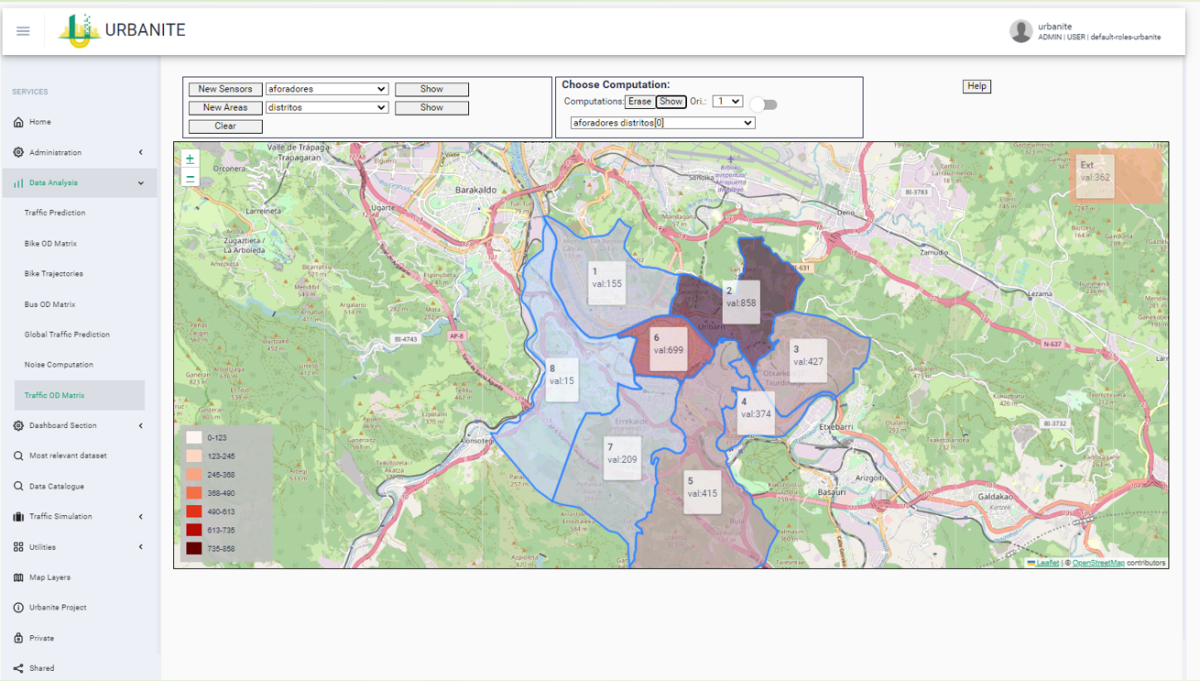
- Public Transport O/D Matrix estimation. Trip-Chaining algorithm to the Smart Card data by estimation of where the passengers that get into the bus at a given stop get off from it.
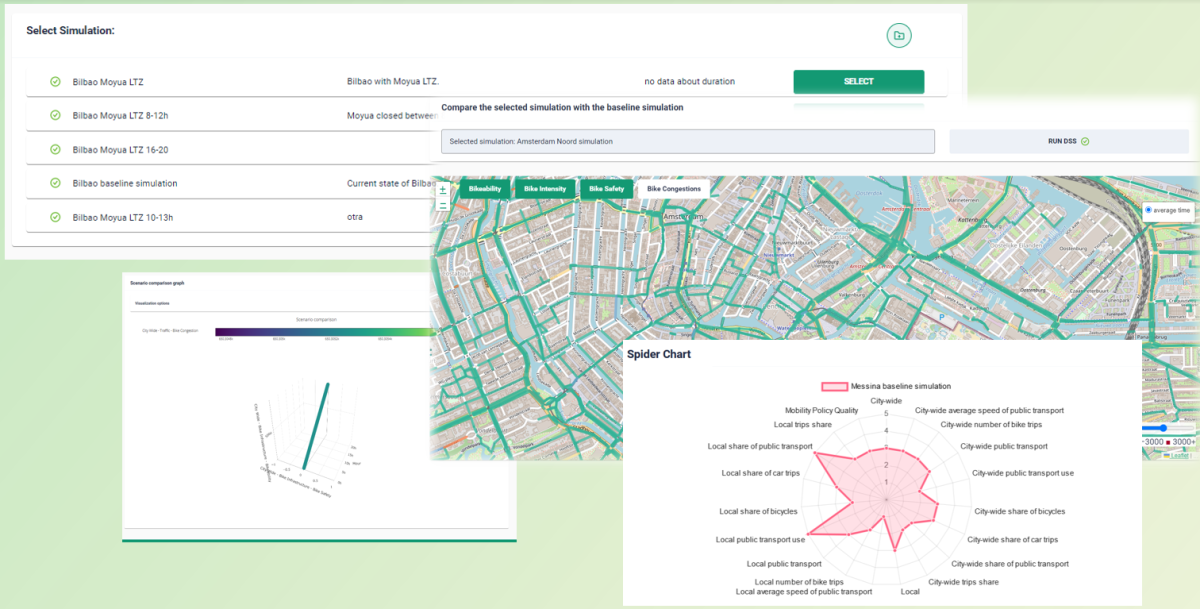
SIMULATION
- Simulations of potential scenarios including: new public transport services, limited traffic zones, dedicated lanes or new infrastructures, based on different models such as population, travel demand and traffic simulation model, fed by real data and calibrated using traffic flow data measured.
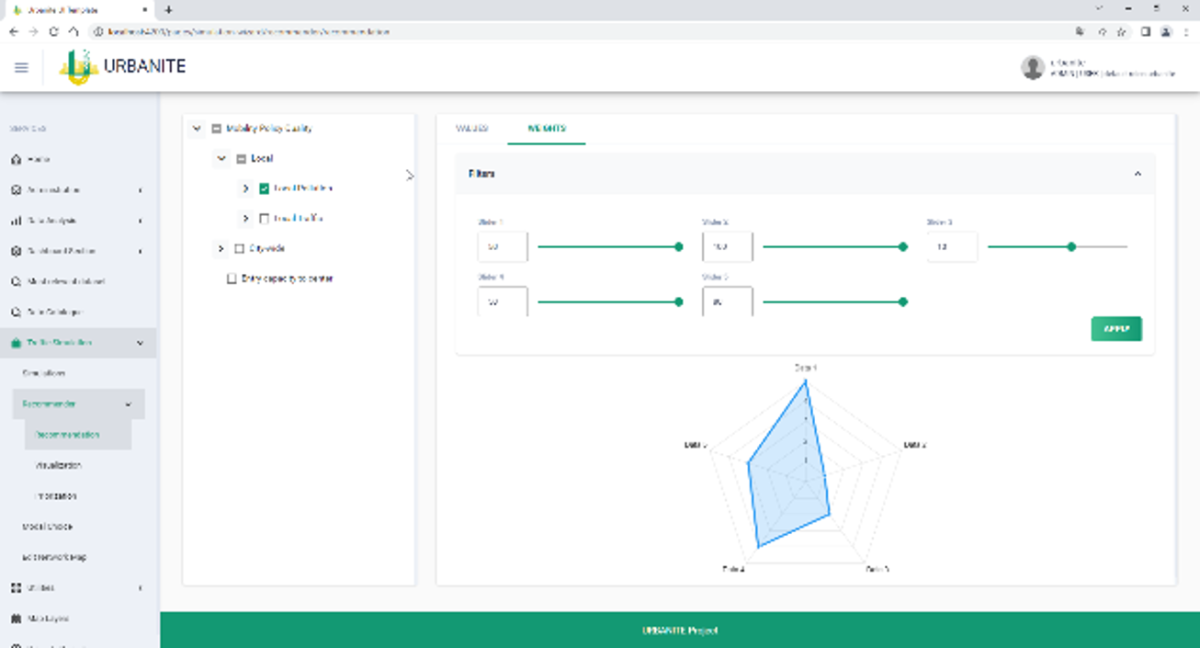
- Multi-criteria decision analysis allows the users to compare proposals among each other or with the baseline (current situation) among several criteria (key performance indicators, KPIs), which may be conflicting.
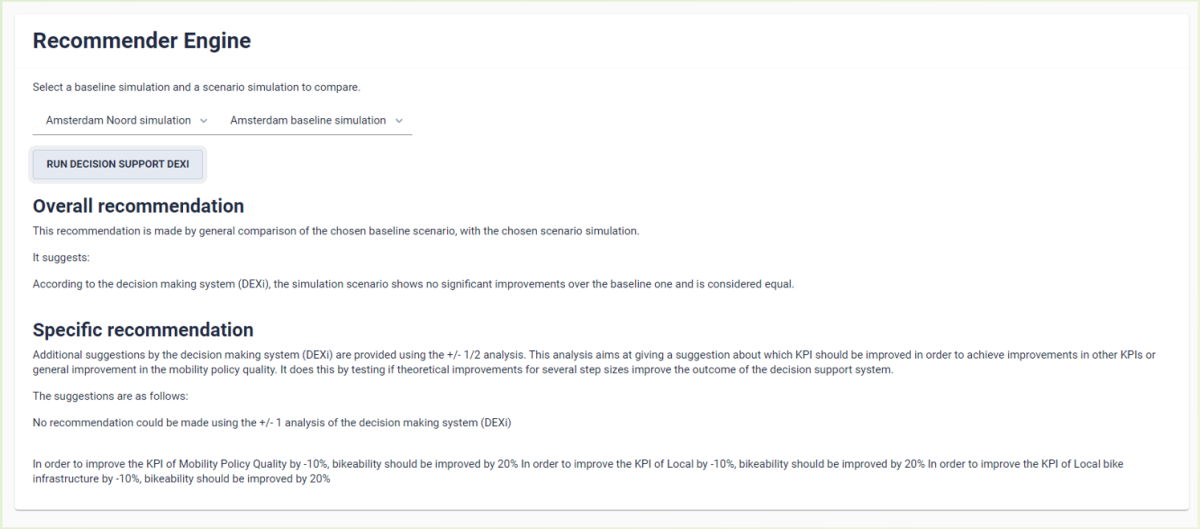
POLICY RECOMMENDATION
The engine provides two types of recommendations:
- General recommendation, information about the overall mobility policy quality, when compared to a baseline.
- Specific recommendations regarding which KPIs should be improved in order to improve the mobility policy quality, achieved by performing a +/- 1/2 analysis.
- Cross-pilot recommendations based on Memory-Based Collaborative Filtering with the preferences and selections of decisión makers.
DASHBOARD MANAGEMENT
- Dashboard Management, different actions are supported:
- Edit the dashboard information Delete the dashboard
- Clone the dashboard Preview the dashboard
- Share the dashboard Edit the dashboard content
- Video: URBANITE Dashboard Creation Process
REFERENCES